How to debug a recipe using the Moderne plugin
One key benefit of the Moderne IDE plugin is the ability to quickly debug recipes against real code. You can set breakpoints in your IDE and have those be hit when you run a recipe in the Moderne CLI – so you can know exactly what is happening in the recipe.
In this short guide, we'll walk you through everything you need to know to do this.
Prerequisites
Please ensure that you've installed and configured the Moderne IDE plugin.
The Moderne plugin is a convenience layer, not a requirement. If you don't use IntelliJ IDEA – or you'd rather not install the plugin – you can drive this entire workflow from the Moderne CLI instead. See Debugging without the Moderne plugin below.
Step 1: Set the active recipe
Open the recipe you wish to debug in IntelliJ IDEA. From there, right-click on the class name. You should see an option to set the active recipe:
Behind the scenes, when you click on Set Active Recipe, an active recipe file will be created at: ~/.moderne/cli/active.recipe.
Step 2: Build LSTs
In order to test a recipe, you will need to run it on a project that has been built with the Moderne CLI.
Open up your terminal and navigate to the directory you wish to build (said directory could contain one or more repositories you wish to generate LSTs for). Then run the command:
mod build .
Step 3: Run the active recipe to confirm it was configured correctly
With the LSTs built and the active recipe specified, make sure that the correct recipe is being run by running the following command:
mod run . --active-recipe
You should see that the recipe you specified in your IDE is the one that is run in your terminal.
Step 4: Debug your recipe
- In IntelliJ IDEA, set one or more breakpoints
- Go to your terminal and run the command
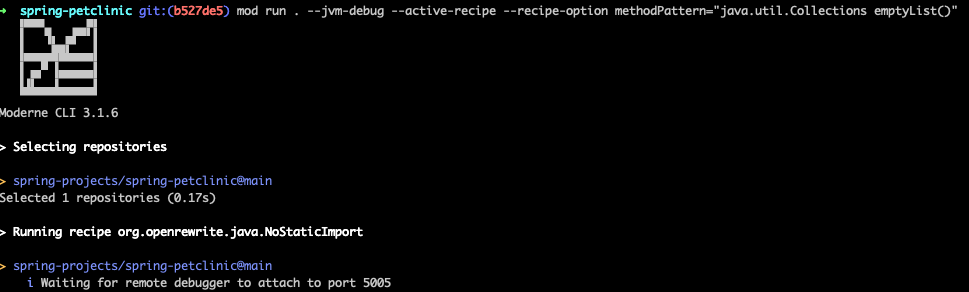
modw --debug run . --active-recipe. The CLI will suspend on startup and wait for a debugger to be attached before running the recipe. By default, it listens on port 5005. You can specify a custom port withmodw --debug=PORT run . --active-recipe.- Note: Depending on the recipe you may need to provide additional parameters in the run command such as
--recipe-option methodPattern="java.util.Collections emptyList()". This will depend on what the recipe itself requires to run. Some recipes may require no params, whereas others may require many.
- Note: Depending on the recipe you may need to provide additional parameters in the run command such as
- Open up your IDE and create a new debug run configuration. You can do this by clicking on the vertical triple dots in the top-right corner, selecting
Edit..., and then adding a newRemote JVM Debug:
- Once you've created the debugger, launch it by clicking on the bug icon in the top-right corner of your screen:

- Your recipe should then begin to run in your terminal - pausing at the breakpoints to allow you to debug. Victory!
Debugging without the Moderne plugin
The Moderne IntelliJ plugin only automates two of the steps above: it sets the active recipe for you (Step 1) and wires up the remote debugger (Step 4). Both are plain CLI mechanisms underneath, so you can debug recipes from any editor – VS Code, Eclipse, Vim, and so on – without installing the plugin at all.
Set the active recipe from the CLI
Instead of right-clicking the class in IntelliJ, point the CLI at your recipe source file:
mod config recipes active set src/main/java/com/example/MyRecipe.java
This detects whether the project uses Gradle or Maven, extracts the classpath, and writes the same ~/.moderne/cli/active.recipe file that Set Active Recipe produces. It accepts .java, .yml, and .yaml files, and takes a --recipe option to select a specific recipe from a multi-document YAML file or a nested Java class.
Confirm what's configured with:
mod config recipes active show
From here, building LSTs (Step 2) and running the active recipe to confirm it (Step 3) are exactly the same – mod build . and mod run . --active-recipe don't depend on the plugin.
Attach a debugger from any IDE
Run the recipe with the wrapper's --debug flag, just as in Step 4:
modw --debug run . --active-recipe
The CLI suspends on startup and waits for a debugger on port 5005 (use modw --debug=PORT run . --active-recipe for a custom port). This is a standard JDWP attach, so any JDWP-capable debugger works:
- IntelliJ IDEA (no Moderne plugin needed) – create a Remote JVM Debug configuration pointing at host
localhostand port5005, then start it. - VS Code – add a
Java: Attachlaunch configuration targeting port5005. - Eclipse,
jdb, or any other JDWP client – attach tolocalhost:5005.
Set your breakpoints in the recipe source before attaching. Once the debugger connects, the suspended CLI resumes and stops at your breakpoints.
To iterate, edit the recipe, rebuild it, and re-run the modw --debug run . --active-recipe command. The active recipe persists in ~/.moderne/cli/active.recipe, so you only need to re-run mod config recipes active set if the recipe or its classpath changes.
The table below maps each plugin action to its plugin-free CLI equivalent:
| Plugin action | Plugin-free CLI equivalent |
|---|---|
| Select the active recipe | mod config recipes active set <recipeFile> |
| Inspect the active recipe | mod config recipes active show |
| Run the active recipe | mod run . --active-recipe |
| Launch with a debugger attached | modw --debug run . --active-recipe |
| Attach the debugger | Any IDE's Remote JVM Debug to localhost:5005 |