Tool browser
The Moderne CLI includes an optional tool browser, a browser-based dashboard for monitoring LST builds and exploring available tools. To enable it:
mod config features agent-tools tray --enabled
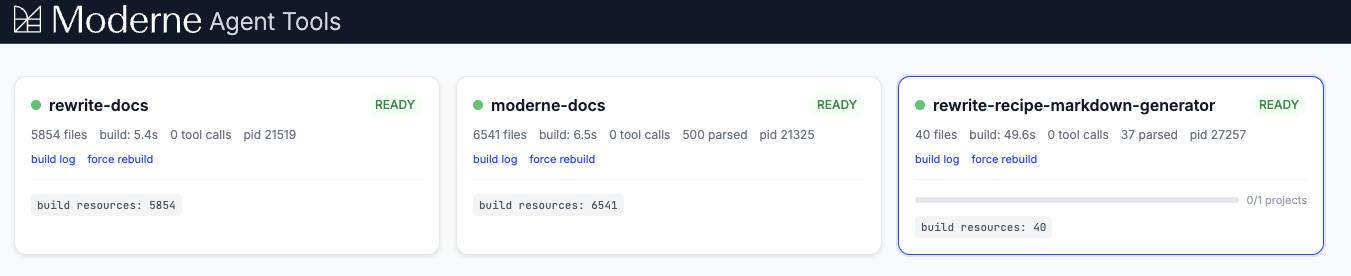
Once enabled, the MCP server launches a system tray icon when an agent starts. Click it to see the status of your projects, then click Tool Browser... to open the dashboard.
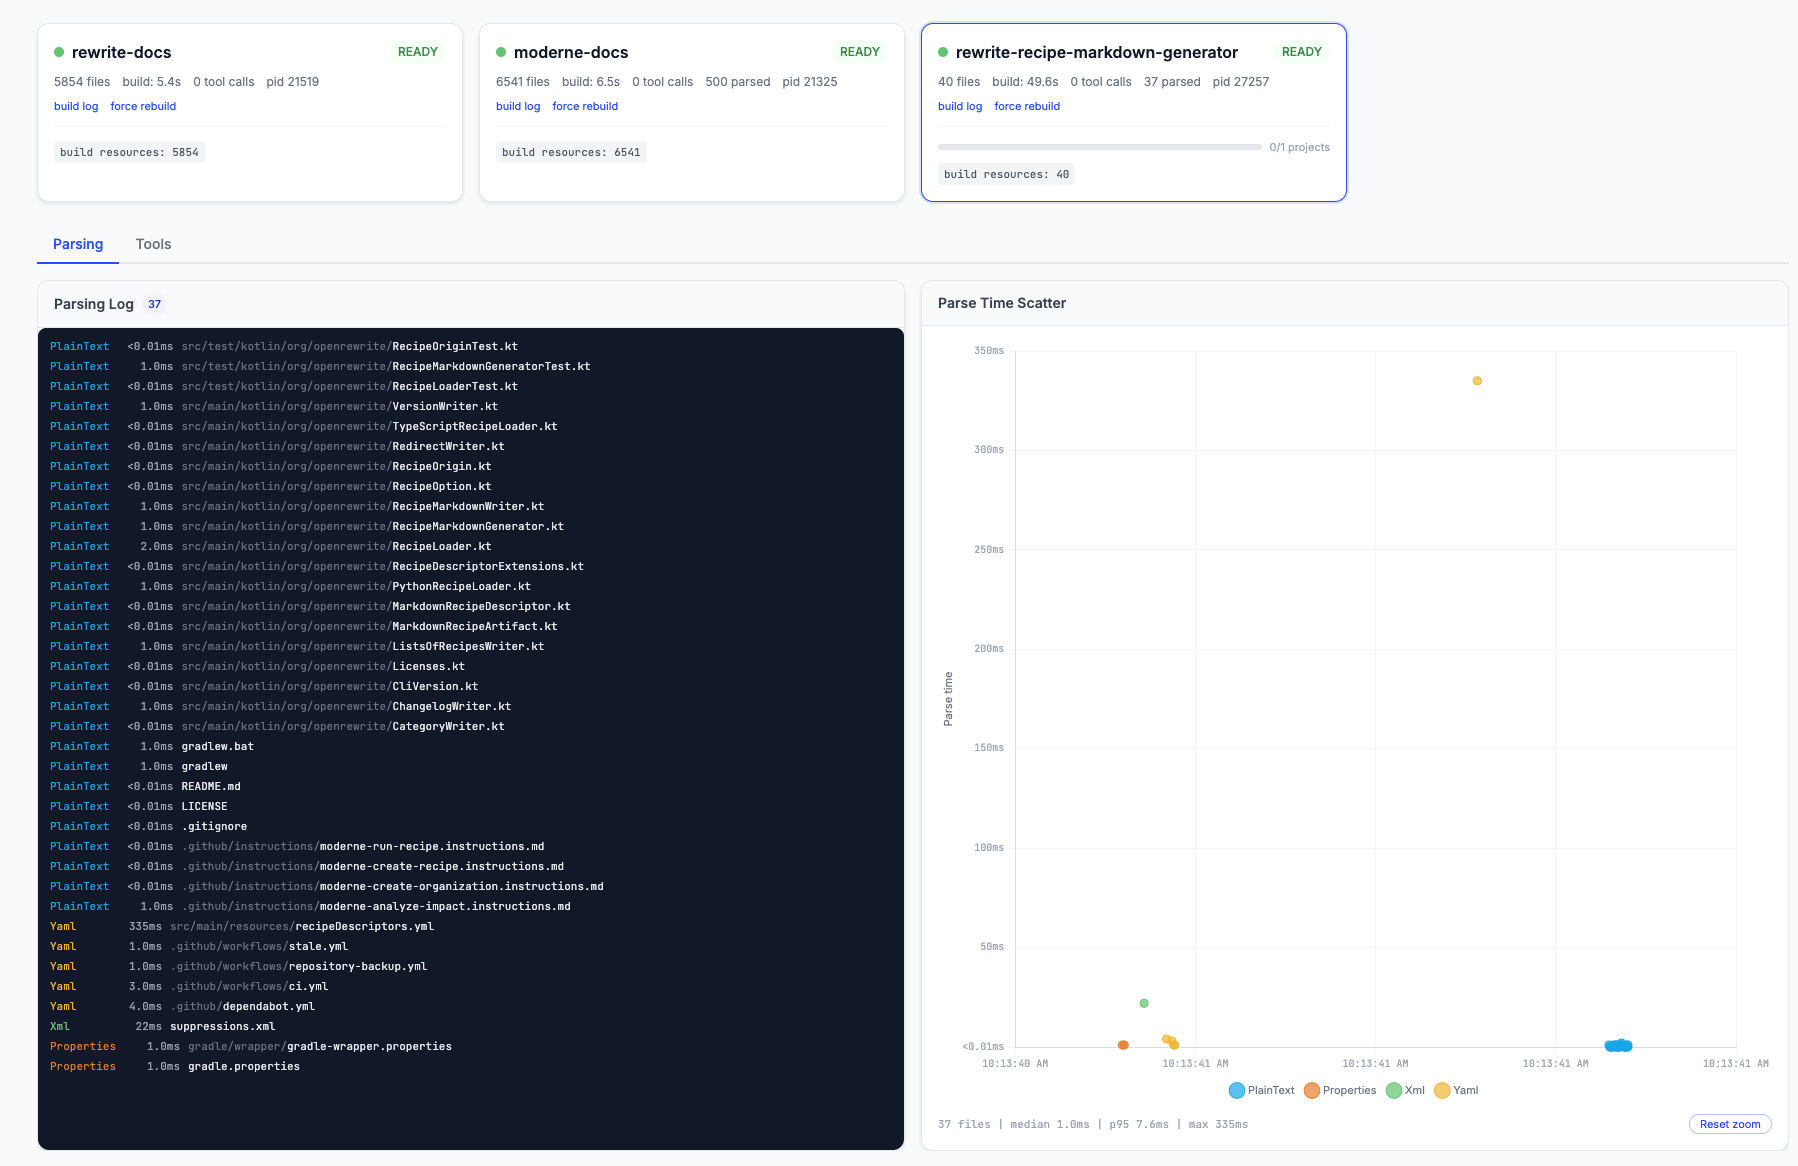
The dashboard shows:
- Project cards with build status, file counts, and tool call metrics
- Build logs with parse timing details
- Tool execution for testing tools directly from the browser