What's changed in SaaS v2
Moderne SaaS v2 brings substantial changes across the platform: more scalable recipe execution, support for more languages, new ways track activity, etc. This doc walks through what's new, what's faster, and what's changed compared to SaaS v1.
New features
Changelog
This feature can be enabled/disabled upon request. Please reach out to your account representative if you wish to use it.
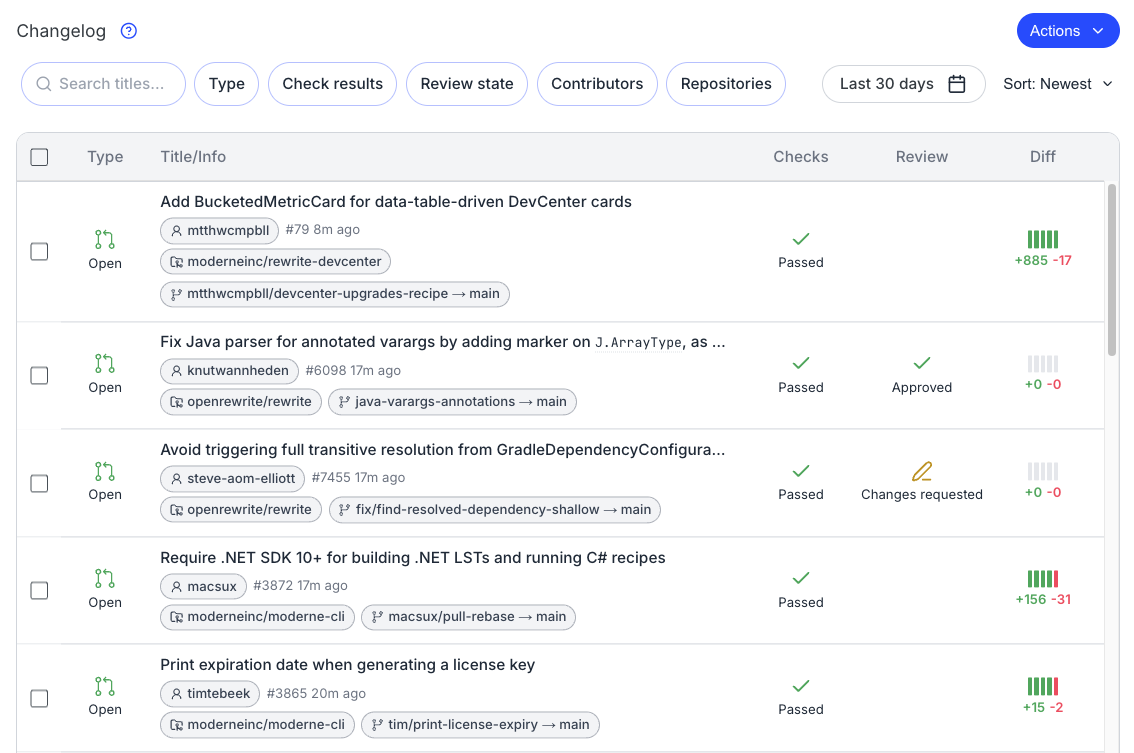
You can now view all code changes across your organization in one place. The Moderne Changelog tracks pull requests, commits, and activity across every repository — so you no longer need to jump between tools to understand what's happening.
Atlas status pages
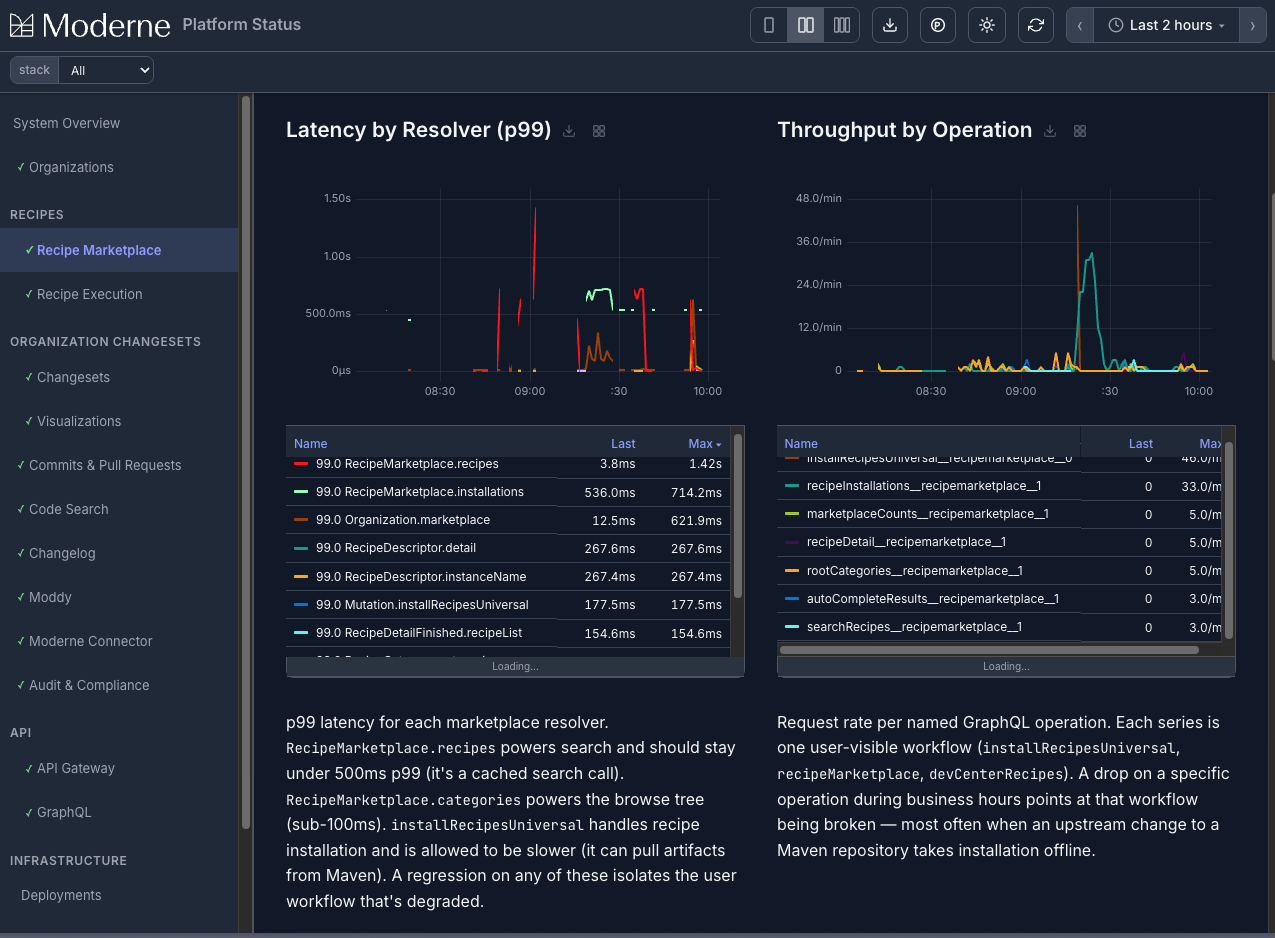
Atlas status pages surface significantly more insight into what's happening across the platform, making it easier to monitor service health and pinpoint issues when they arise.
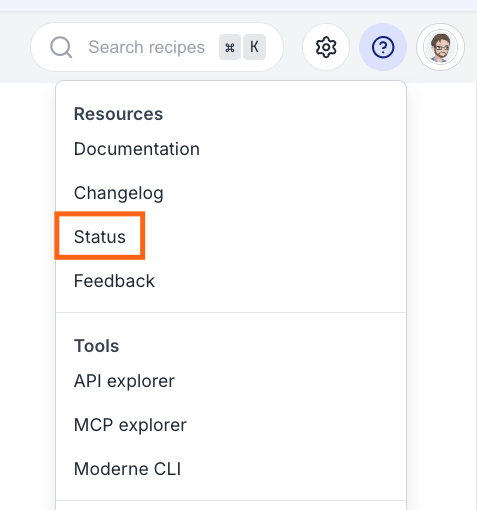
You can access this page by clicking on ? icon in the top-right of the SaaS and then selecting Status:
Continuous profiling across the platform
This feature can be enabled/disabled upon request. Please reach out to your account representative if you wish to use it.
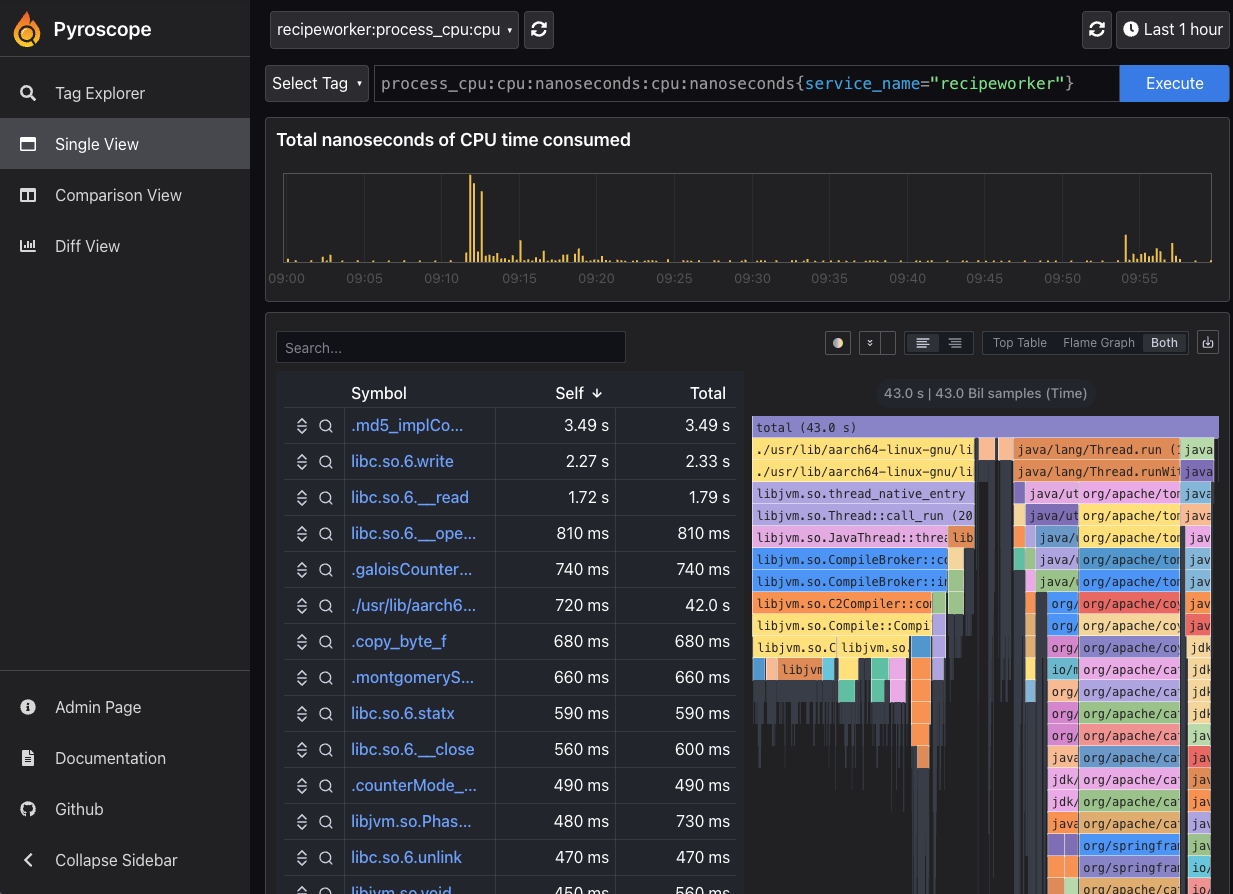
SaaS v2 ships with Pyroscope-based continuous profiling for every microservice in the platform — authorization, organization, the recipe worker, Moddy, the marketplace, and more. You can inspect CPU usage, memory allocation, mutex contention, and blocking time as flamegraphs, making it much easier to track down performance regressions wherever they live in the stack. When a recipe is running slowly, profiling the modernecli application can pinpoint exactly which code path is responsible.
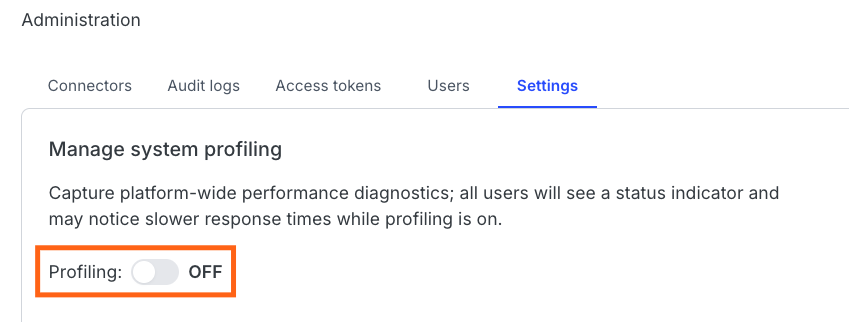
To enable profiling, you'll need to be an admin. Then click on the gear icon in the top-right and select Settings. You should then see a profiling enable button. Please note that performance may decrease while profiling is enabled.
Native recipes in more languages
SaaS v2 can run native recipes written in more languages now. These include JavaScript, TypeScript, Python, C#, and Go.
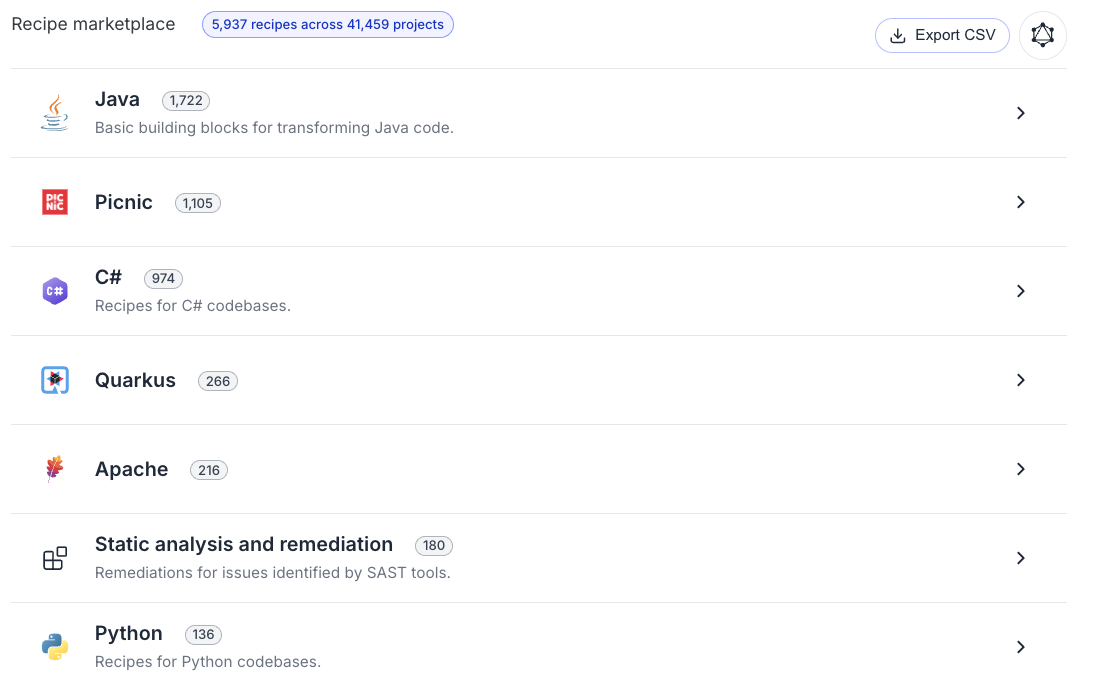
Customizable marketplaces
Marketplaces can now be configured differently for different organizations, allowing you to create mini sandbox environments for testing specific recipes within a subset of your org. The marketplace UI has also been redesigned based on customer feedback.
Performance improvements
Recipe scalability
Recipes can now run against substantially larger organizations than before. As part of this work, data tables that previously could not be generated due to the number of repositories involved can now be produced reliably.
Moddy works in restricted environments
Previously, Moddy did not work in locked-down environments because it relied on server-sent events. Moddy now polls for updates instead, so it works in restricted environments where server-sent events are blocked.
Faster builder for large recipes
The recipe builder has been improved in two ways:
- Referential de-duping for pre-packaged recipes reduces redundant text while keeping descriptions accurate.
- Builds are substantially faster for larger recipes.
Functional changes
Moderne Agent renamed to Moderne Connector
The Moderne Agent has been renamed to the Moderne Connector to avoid confusion with AI agents. Configuration has also been reorganized to more clearly separate settings per microservice and functional component.
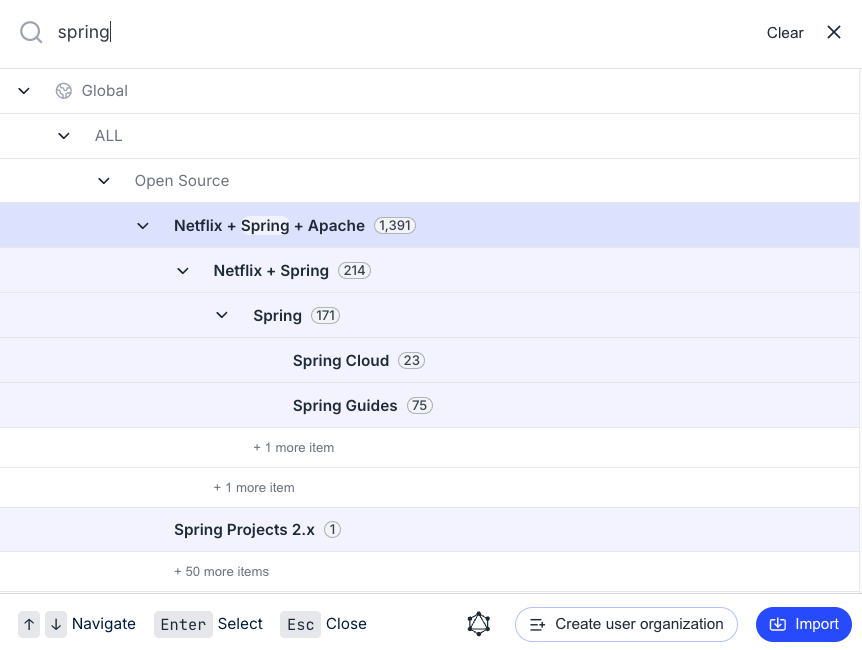
Redesigned org viewer
The org viewer has been redesigned based on customer feedback:
- The org selector now shows how many repositories are in each org.
- Search is more visually clear and provides more context about what you're searching for.
- You can search for a parent org and quickly navigate to its child orgs.
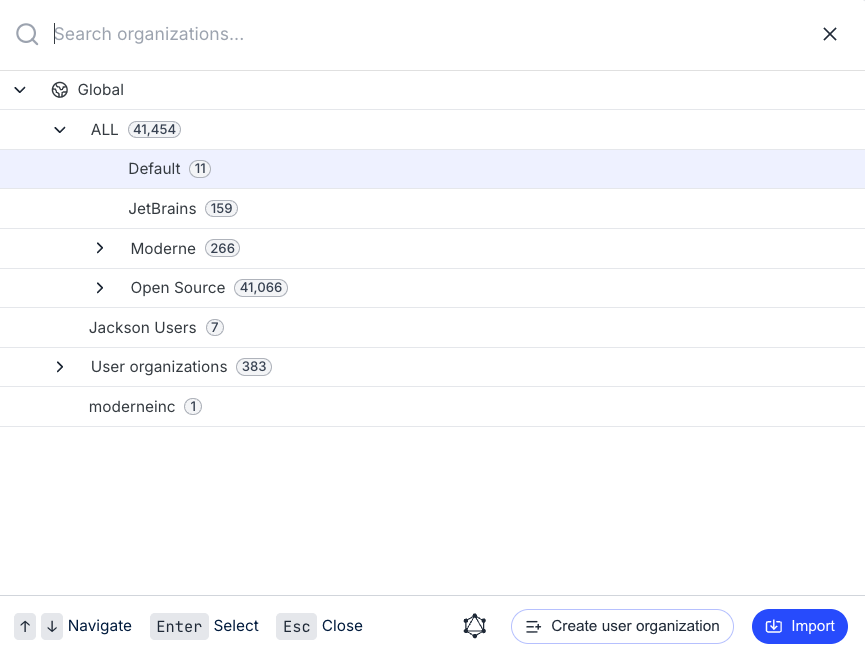
Global org
There is now a global org that encompasses every organization, including user orgs. This makes it easier to run recipes and view activity at the highest level of your org hierarchy.
Updated deploy page
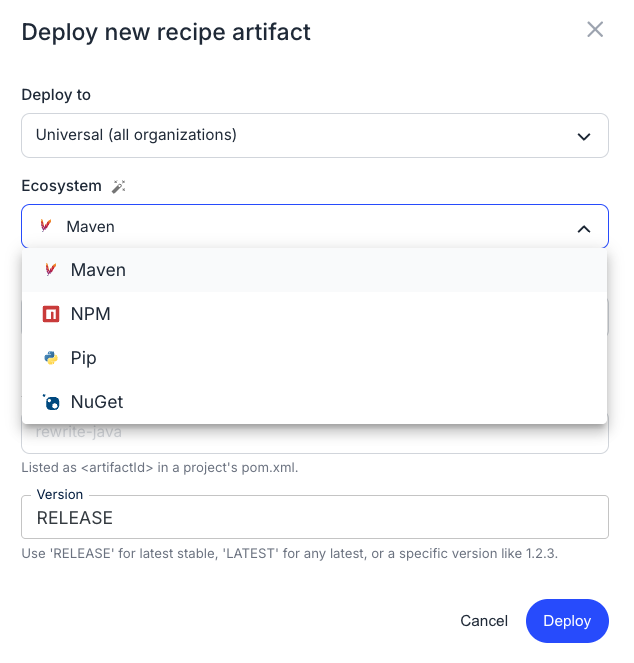
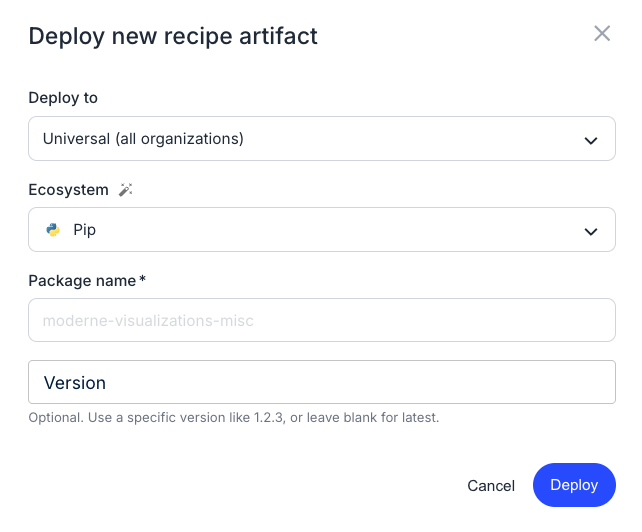
The deploy page has been substantially updated:
- You can now deploy recipes from ecosystems like pip and NuGet, which was not previously supported.
- The Add artifact modal has smart defaults and clearer ecosystem-specific syntax, making it easier to understand what to enter for each ecosystem.
- For instance, if you wanted to deploy an NPM artifact, the version dropdown would let you specify a specific version or use the latest/next tag - with descriptions of what each did. In contrast, if you tried to deploy a Pip artifact, the version dropdown would not include a "next" tag as that doesn't apply to Pip artifacts.
Audit log changes
The audit log UI has been removed. Audit logs are now available only as a CSV or CEF download.
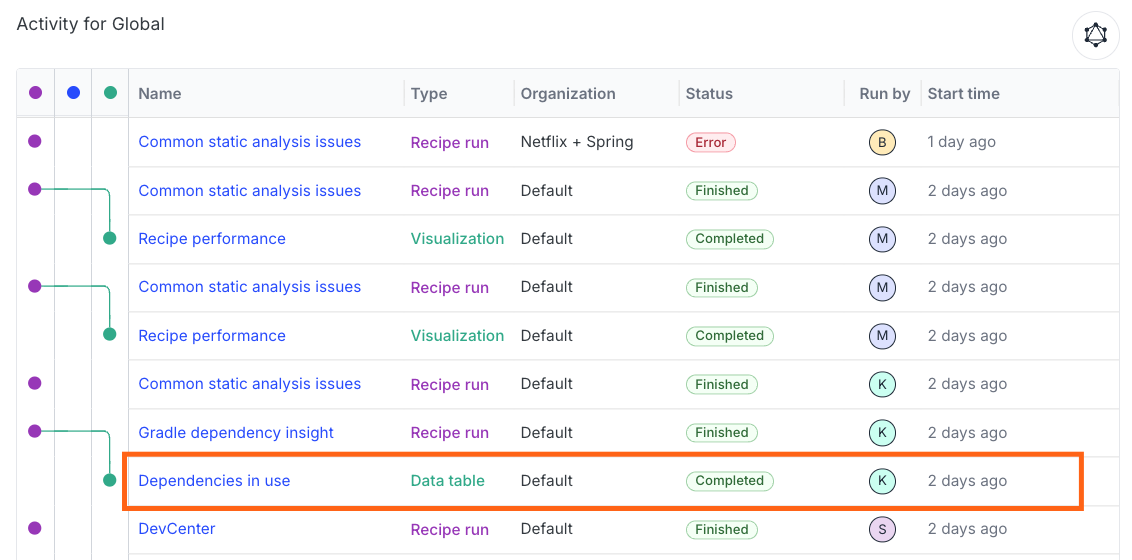
Activity view surfaces data tables
The activity view has been expanded to include data tables. If someone in your organization has already generated a data table, you can find it in the activity view instead of regenerating it yourself.
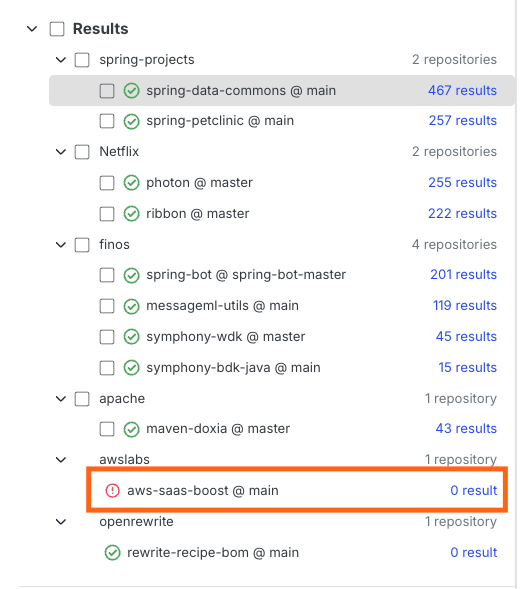
Failed repositories now appear in results
Previously, if a repository failed during a recipe run, it did not appear in the results view — you had to check the status tab to see why it was missing. Failed repositories are now included in the results view and clearly labeled as failures.
Recipe results persist between deployments
Recipe results, data tables, and visualizations now persist between deployments. Previously, they were wiped on every deployment; now they stick around, giving you context into what happened over a longer period of time.